
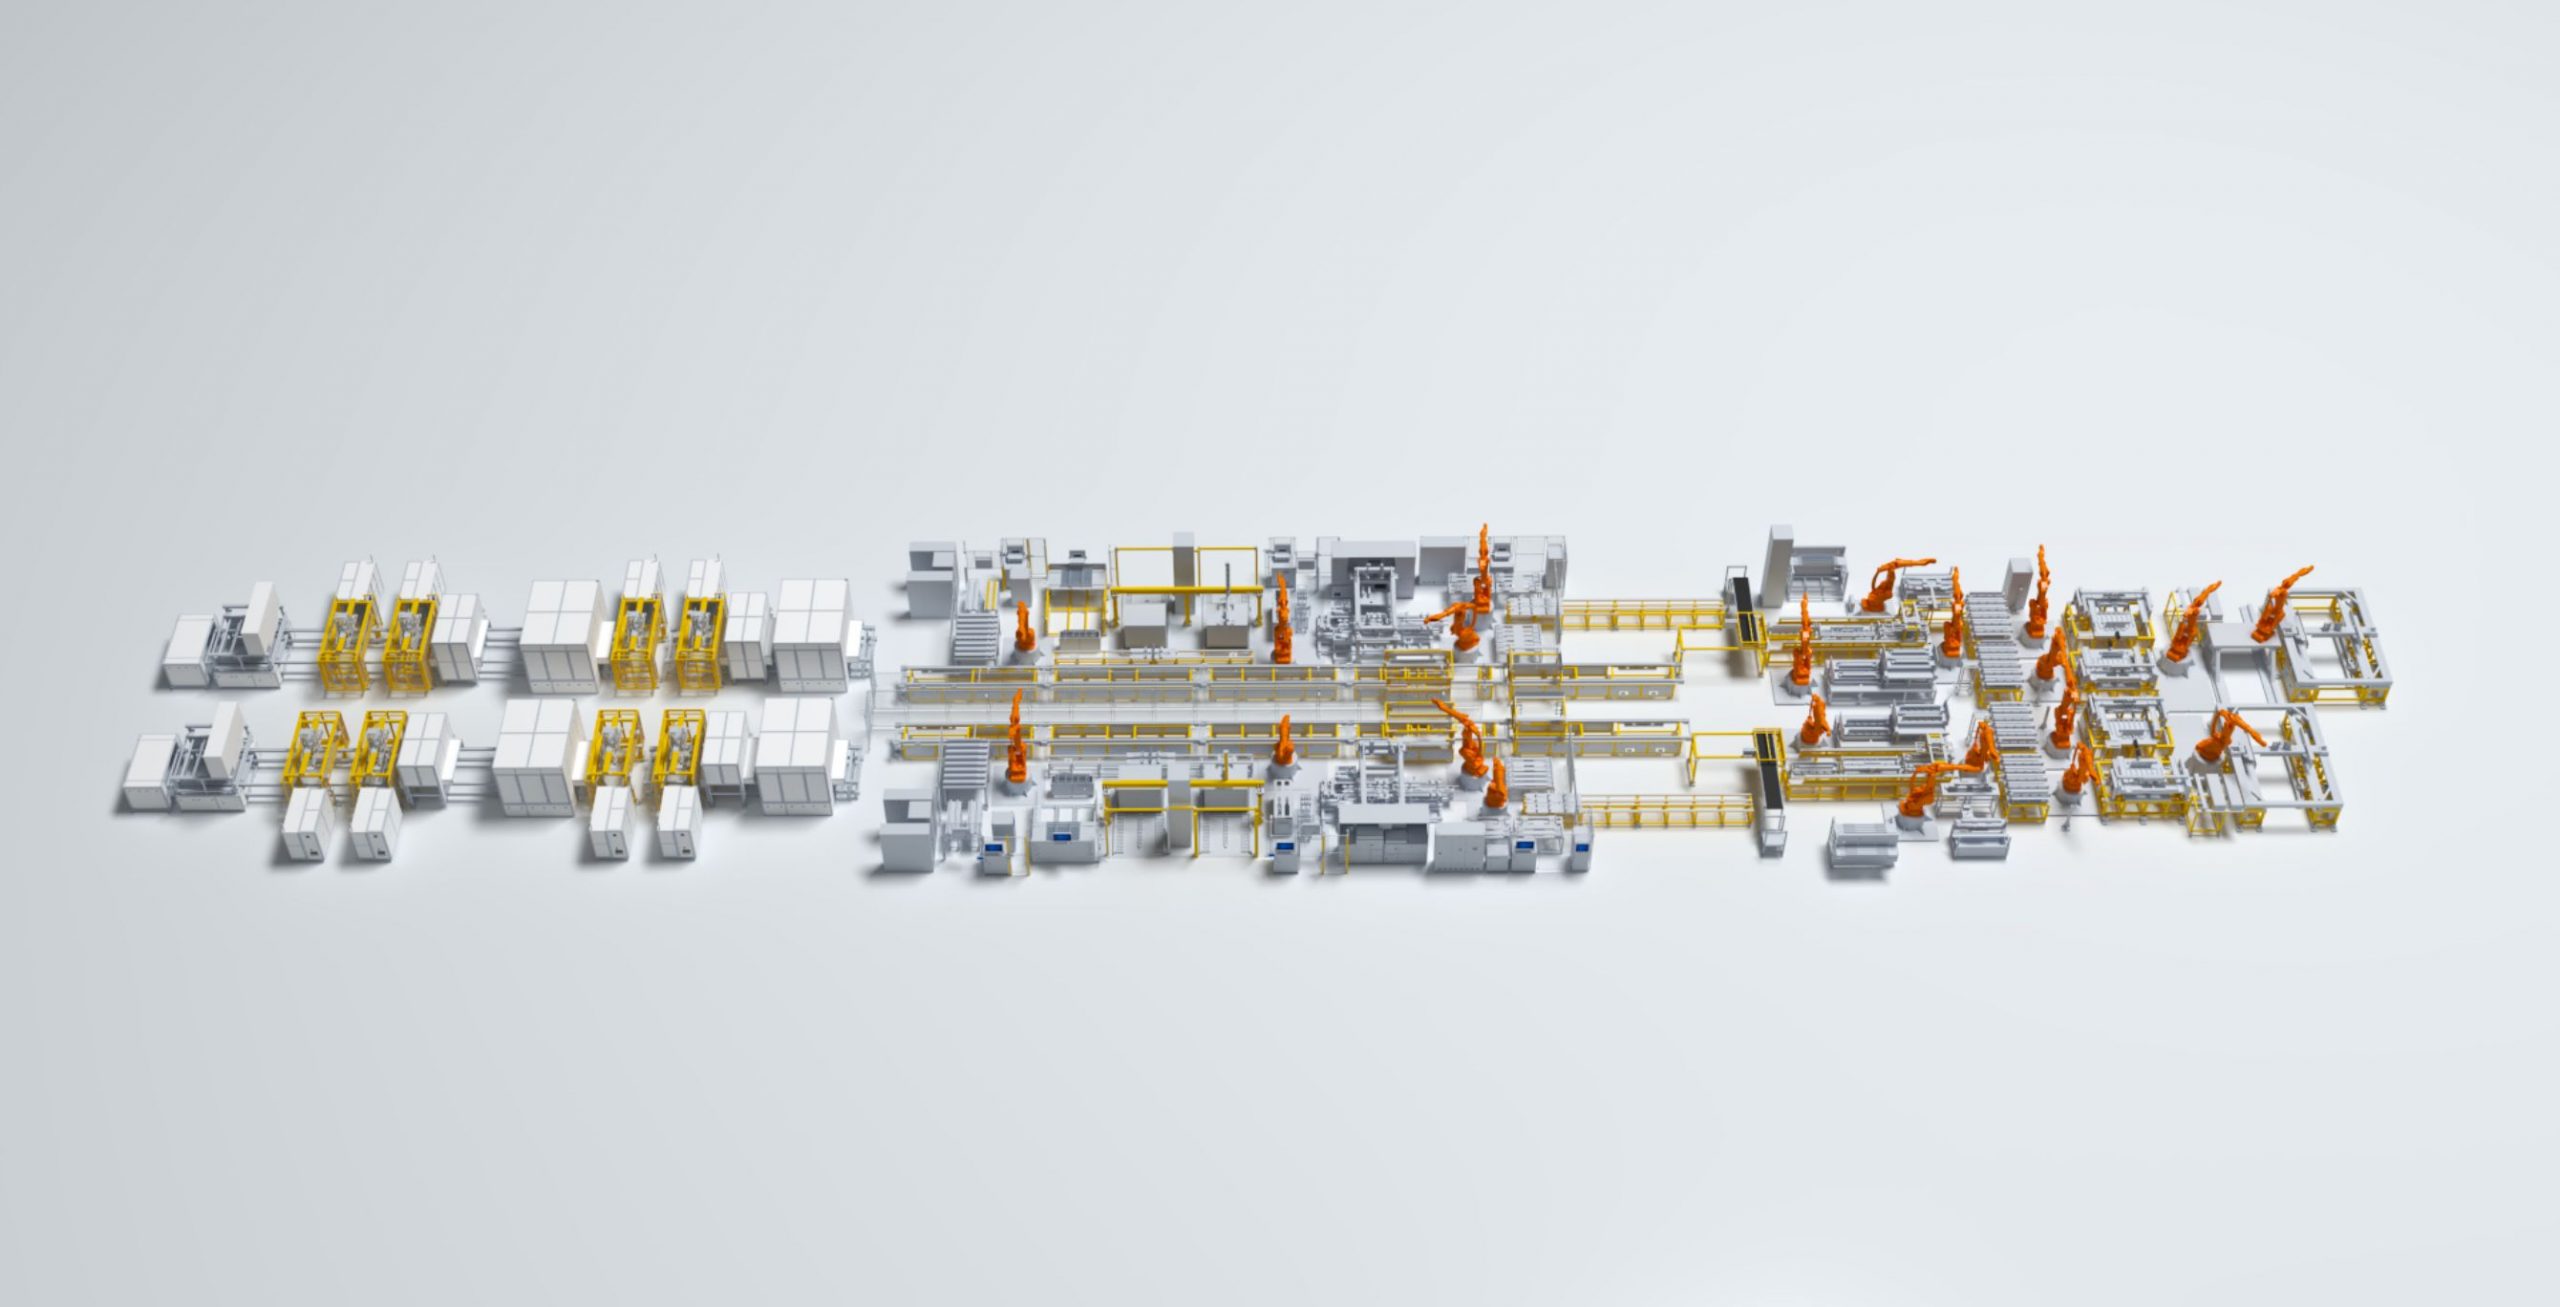
When cells fail in silence
The problem is simple and severe: a single hidden defect in a blade battery can turn a quiet assembly hall into a costly recall. On a blade battery assembly line the signs are subtle — a whisper of heat, a stray voltage drift, a misaligned tab — and those whispers compound into loss. You need to know which signals matter before they become screams. This piece lays out the faults you’ll face and the exact data points that stop them from spreading.
Core faults that demand tracking
Problems recur in patterns. Watch for these and you’ll catch the pattern early.
- Electrochemical variance: cell-to-cell voltage and internal resistance imbalances that predict premature capacity loss.
- Thermal anomalies: local hotspots during formation, drying, or fast-charging steps.
- Mechanical defects: tab misalignment, weld cold joints, and casing deformities that lead to isolation failure.
- Contamination events: particulate or moisture spikes traced to specific workstation windows.
- Process drift: changes in dispense volume, temperature setpoints, or cycle times that silently shift yield.
Track these relentlessly. They expose the root cause before the fault escapes the line.
Metrics to monitor — precise and prioritized
Order matters. Monitor these metrics continuously, in this priority:
- Voltage distribution across cell strings — detect imbalance early.
- AC impedance and DC internal resistance per cell — reveal subtle aging or assembly damage.
- Surface and core temperature profiles during formation and charge cycles.
- Laser-weld energy and filament feed logs for every weld cycle.
- Humidity and particle-count events in enclosure zones during electrode handling.
- Dispense volume and mass-per-unit for electrolyte and adhesive steps.
Each metric ties to a failure mode. Collect timestamps and station IDs so the failure’s path can be reconstructed like a map of shadows.
Sensors, sampling cadence, and data fusion
Bad readings create false hunts. Use higher-fidelity where the risk is higher.
- Voltage and impedance: continuous per-station sampling with rolling averages and short-window anomaly detection.
- Thermals: distributed thermocouples plus periodic infrared scans; cross-check both streams.
- Welds: inline optical measurement and force/energy logs per weld; sample 100% when yield dips, 10–20% otherwise.
- Contamination: continuous humidity and particle counters; trigger full-line quarantine on excursions.
Fuse signals. A small impedance rise paired with a micro-hotspot points to mechanical stress at the tab. Alone, either signal might mislead.
Common pitfalls and how to avoid them
Teams trip on three soft faults.
- Overlooking shift-level variation — operators change technique; track per-shift baselines.
- Ignoring upstream quality signals — a bad electrode batch shows up as pattern noise later; tag material lot numbers.
- Logging without context — mass data without process-state flags becomes noise; annotate every record with step, operator, and lot metadata.
Fix these by making metadata mandatory, automating alarms that require human confirmation, and owning the feedback loop from test lab back to line.
Practical checks for commissioning and daily operation
Do these simple actions every day.
- Run a short impedance sweep on a sampled cohort at shift start.
- Verify calibration stamps on welders and dispense heads before the first batch.
- Audit environmental logs against production lots every 12 hours.
- Hold a five-minute “failure pattern” huddle at shift change — share anomalies, not conjecture.
These steps cut mean time to detect. They force attention where the line is weakest.
Where tools falter and human judgment matters
Algorithms catch trends; humans trace intent. Automated alarms will flag dozens each day. The skill is triage: ignore the noise, escalate the signal. Preserve traces. When a cell ruins a pack, you’ll reconstruct its life from timestamps, weld logs, and environmental tags. That reconstruction wins recalls or averts them. This was clear during commissioning at a Shenzhen facility, where correlating weld-energy drift with humidity excursions halted a rising defect rate before mass shipment.
Integrations and a brief comparison of approaches
Choose one approach per risk zone:
- Edge-first: local controllers handle immediate alarms and cutoffs — best for weld and dispense faults.
- Cloud-analytics: centralized models spot slow drifts across shifts and lots.
- Hybrid: edge filters for urgent actions; cloud for trend analysis and model retraining.
Use edge for life-safety and immediate containment; use cloud to learn across lines. Neither alone suffices.
Final reckoning
Measure the right things, and the night in your plant lightens. When you make voltage, impedance, thermal, weld, and contamination signals primary, you stop small faults from becoming disasters. Keep metadata strict, sample where risk concentrates, and fuse signals to reveal cause. For teams building resilient blade battery production systems, practical rigor yields fewer surprises and clearer answers—just the sort of steadiness that FHS brings to field-proven lines.